David M. Callahan, Ph.D.
Providing Psychological Services to
Cape Cod and Southeastern Massachusetts

In order to understand the data presented in a neuropsychological evaluation, which provide a large array of scores, it is necessary to have at least a beginning understanding of statistical principles. Below I will attempt to describe in simple terms the basic structure of the test and the nature of the scores that they provide.
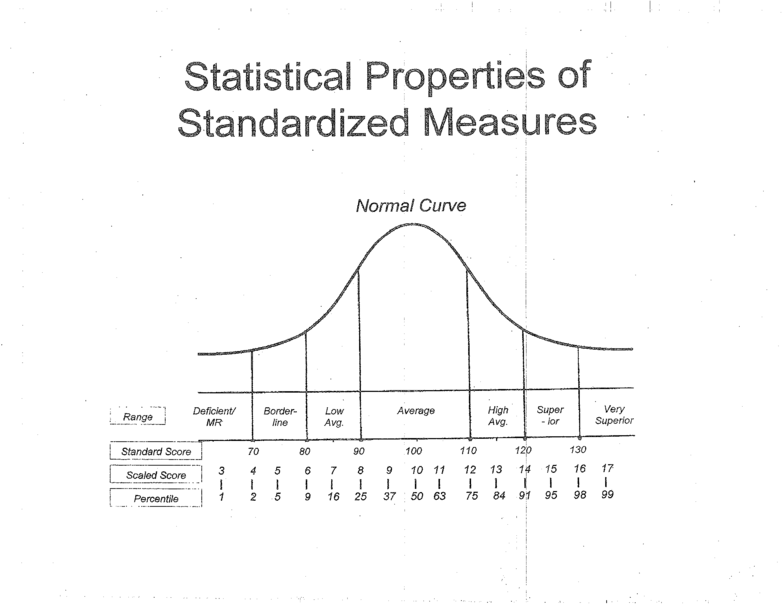
Virtually all neuropsychological and psychological tests are placed on what is known as a normal curve, the “bell curve” that most of us has encountered at some point in our lives, (see below). The nature of the bell curve is that there are far more people close to the average score (also known as the mean) and fewer people as we move further away from that average. This holds true for many naturally-occurring aspects of life, such as height and weight, and in intellectual ability and a variety of other skill sets. The tests provided almost all have a similar structure. Typically, the mean Standard Score is 100, meaning that a score of 100 places an individual on the 50th percentile (percentiles are the number of people out of 100 that one’s performance equal to or better than). Thus, an “average” person will fall at the 50th percentile. The scores then spread out in a defined way with what is known as a standard deviation of 15. Without belaboring that term too much, persons within one standard deviation of the mean or average score encompass roughly 68% of the entire group of people. As we move out to + or - 2 standard deviations, it encompasses 95% of the people. At 3 standard deviations, we encompass 98%. Thus, a person’s score helps us to determine at what percentile rank they fall. Most tests use a similar description of their pattern of scores.
Standard scores between 90 and 109 are generally seen as falling in the “Average” range. This falls between roughly the 25th and 75th percentile, placing half of the people within the Average range, a fairly intuitively sensible approach. As we move up the ladder into higher levels of functioning, scores between 110 and 119 are described as in the High Average range, falling between the 75th and 90th percentiles. Scores between 120 and 129 are described as the Superior range, reaching from the 91st to the 98th percentile. The upper 2% are described as falling in the Very Superior range.
As we move down to lower areas of functioning, scores in the 80’s are referred to as the Low Average range, falling between the 9th and 24th percentile. Scores in the 70’s fall between the 2nd and 8th percentiles, falling in the Borderline range. Scores below 70 encompass the bottom 2% of individuals, and are referred to Deficient or Very Low scores depending on the measure. The use of similar scores across tests allows us to make comparisons between different scores that enhance our understanding the pattern of scores.
Several tests also have what are known as “scaled scores.” These are typically subtest scores. An average scale score is 10, falling at the 50th percentile with each scale score essentially representing an interval of 5. Thus, a score of 9 is equivalent to a 95, with a score of 11 equivalent to 105. Thus, a scale score of 6 is like an 80, a 4 is like a 70, a 12 like 110, a 14 like 120, etc. At least one of these scores is utilized on virtually all tests, allowing for comparisons across different tasks.
To understand the meaning of those ranges, the typical person in the Average range can manage most things that would be expected of him or her within the area being assessed at a reasonably effective level. Persons in the High Average range, previously referred to as “Bright,” are generally somewhat above average and can manage a broad range of tasks very successfully. As we moved into the Superior and Very Superior ranges, we see people show a high level of talent in that specific area. Moving into lower scores, persons in the Low Average range typically can manage most straightforward daily material well, but may struggle as tasks become more abstract and complex. Scores in the 70s usually represent areas of significant weakness, with difficulty performing beyond fairly basic levels in that area. Scores under 70 reflect very weak scores falling in the Deficient range (or in the range of Intellectual Disability if we are referring to IQ scores).
It is always important to remember that scores are only estimates of functioning that there is always a certain amount of error within each score. The overall pattern of scores is far more important than an individual score. However, having some awareness of those scores can be helpful in assessing a person’s functioning.
Part of the theory of neuropsychological assessment is that persons with relatively “cleanly wired” brains will tend to score fairly consistently across different tasks. It is the variability across tasks that is ultimately is the most meaningful data that will be assessed by a neuropsychologist.
Understanding Testing Scores